
Leveraging social media data is crucial for designing effective marketing campaigns. Businesses can greatly enhance their marketing strategies by focusing on data-driven approaches, allowing them to target the right audience, boost brand awareness, and increase engagement rates. By utilizing insights derived from social media analytics, … Continue reading “Leveraging social media data for effective marketing campaigns”
How to measure the success of your email marketing campaign
It’s important to measure email marketing when running campaigns. Email marketing platforms, such as DailyStory, include built-in analytics tools you can use to understand how your emails are performing. The good news is that email marketing is easy to measure. Most email marketing services, including … Continue reading “How to measure the success of your email marketing campaign”

How to evaluate your franchise marketing data
Gathering marketing data is a great first step to understanding your franchise’s target audience and ensuring your campaigns are effective. However, after gathering data, you’ll need to understand that data by being able to read and evaluate it. Evaluation is key to ensuring you cut … Continue reading “How to evaluate your franchise marketing data”
8+ content marketing metrics you should track
Content marketing plays a key role in many digital marketing strategies, but what metrics should you be following to ensure that what you’re doing is working? Content marketing is essentially described as the creation and publication of content in order to build an audience and … Continue reading “8+ content marketing metrics you should track”

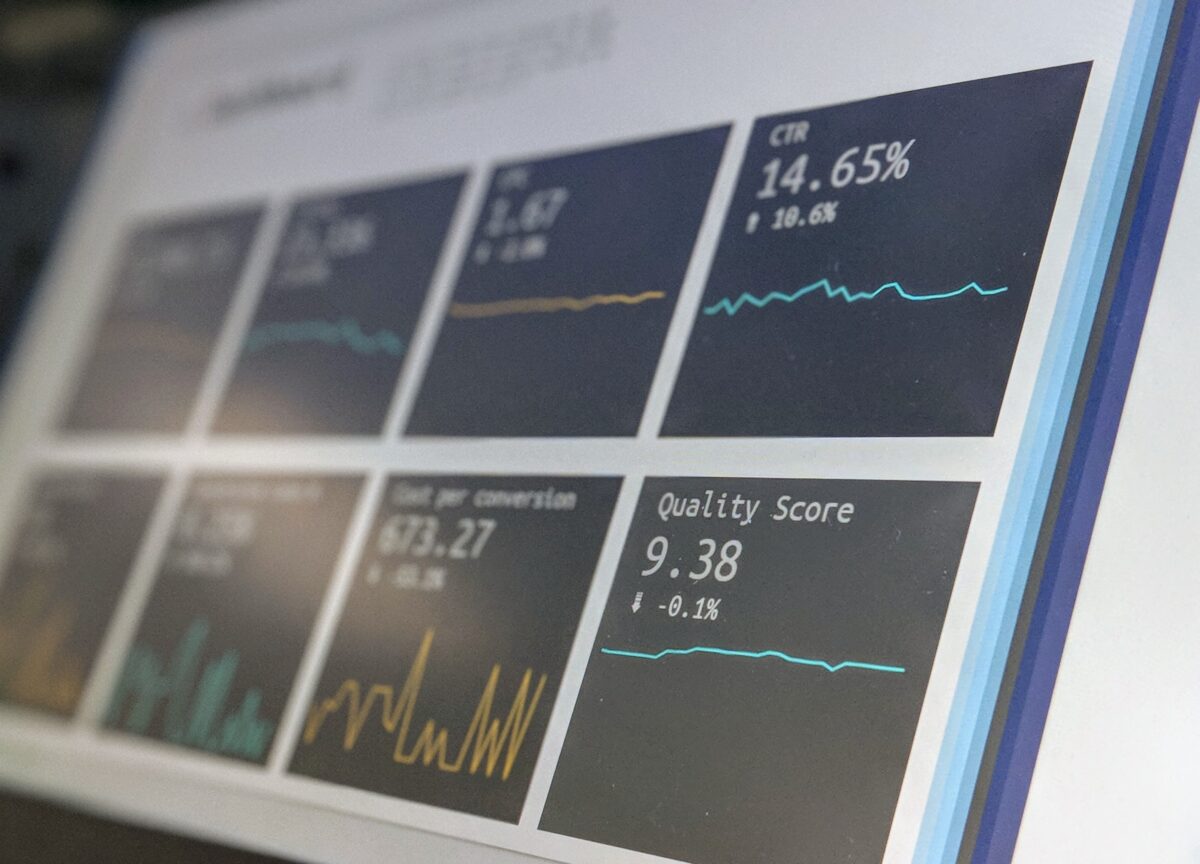
26 social media metrics you should track across platforms
Are you paying attention to the right social media metrics? Social media marketing can help you achieve your business goals, but it’s important to track your social media metrics to understand what’s working and what’s not. About 43 percent of consumers increased their social media … Continue reading “26 social media metrics you should track across platforms”

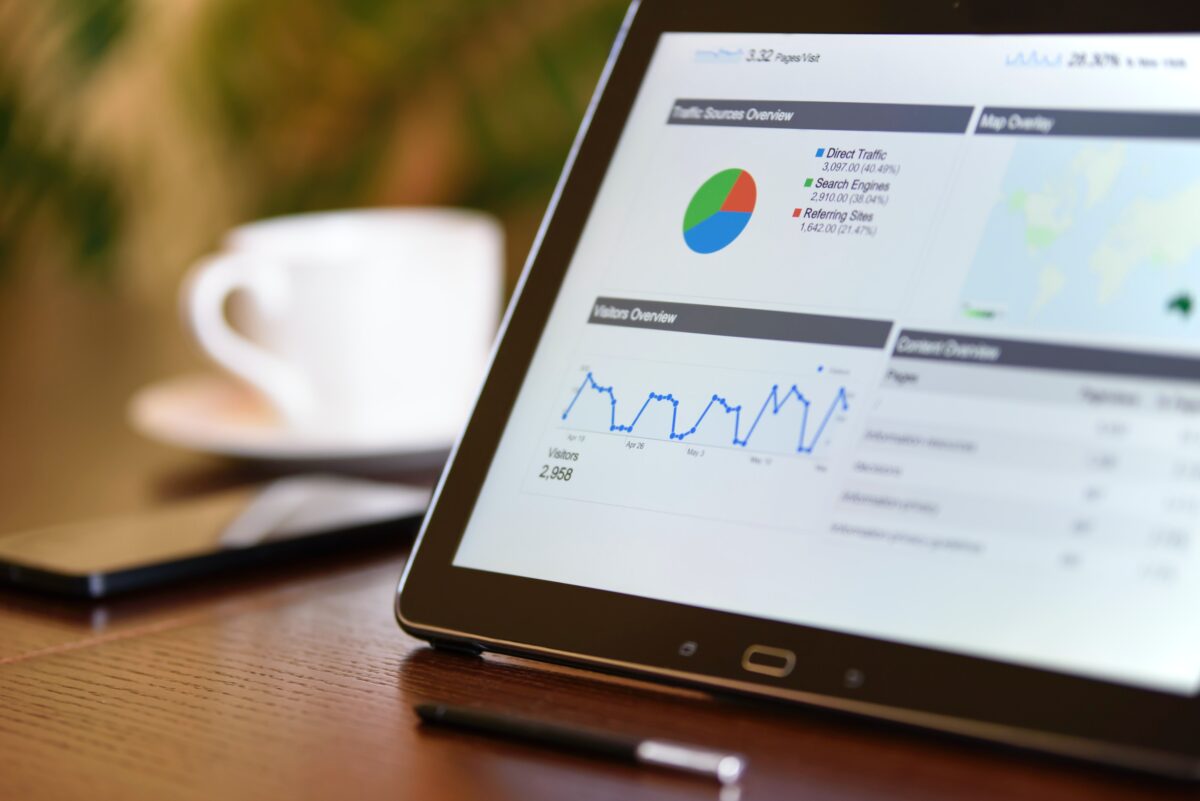
9 tips to get the most out of Google Analytics
Your performance data should be the lifeblood of your digital marketing strategy. But when it comes to using Google Analytics, are you more of a casual user than you’d like to be? Maybe you’re not checking as often or only get a vague notion of … Continue reading “9 tips to get the most out of Google Analytics”

How to evaluate your company’s marketing data
Gathering marketing data is a great first step to understanding your target audience and ensuring your campaigns are effective. However, after gathering data, you’ll need to understand that data by being able to read and evaluate it. Evaluation is key to ensuring you cut out … Continue reading “How to evaluate your company’s marketing data”

Snapshot: Understanding your metrics on Instagram
Instagram has shown itself to be one of the fastest-growing social media platforms. Any successful account should have a sense of what’s working and what’s not for its audience. On Instagram, you can find Insights data in three different places in the Instagram app. To … Continue reading “Snapshot: Understanding your metrics on Instagram”

Snapshot: Understanding your metrics on Facebook
If you’re managing a Facebook page, it’s critical to know what’s working (or not) with what you’re posting. It’s also important to get a real sense of who your audience is. And all that data can be found in Facebook Insights. You’ll find Facebook Insights … Continue reading “Snapshot: Understanding your metrics on Facebook”
Want to receive more great content like this for free?
Subscribe to our newsletter to get best practices, recommendations, and tips for digital marketers