Reporting on Lead Conversion Funnel

We’ve had some great feedback from our customers so far and continue to push out bug fixes and features almost every day.
We have slowly started turning on some of the reporting features for a few of our customers. Later today we’re going to enable our next report, lead summary report, and I thought I’d highlight it briefly:
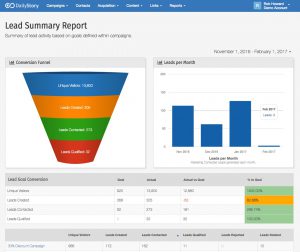
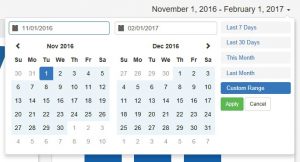
The lead summary report provides an overview of all lead activity filtered by date. For example, in this report we filtered to only show data from November 1, 2016 through February 1, 2017:
We’re also building campaign-specific reports too, but those aren’t ready yet.
Conversion Funnel
The conversion funnel is a graph that shows how visitors flow through the conversion process:
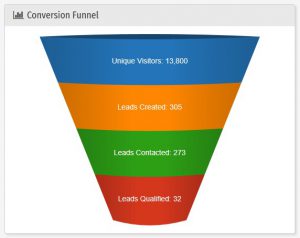
The conversion funnel shows us the total number of unique visitors. This isn’t total website visitors, just unique visitors to content related to the campaign such as a landing page, form or mobile view (though an API call).
Next, we see the total number of leads created and the number of leads contacted. The number of leads contacted includes leads that have been accepted as qualified and removes any deleted or rejected leads.
Finally, the leads qualified are the number of leads that have been accepted and passed on to the CRM (such as Salesforce).
Leads per Month
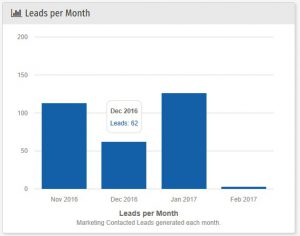
The next report is a graph that shows the number of leads generated each month for the date range we’ve selected. This report helps visually identify trends that may be due to seasonality. For example, in our demo data, which is based on some scrubbed customer data, we can clearly see the drop-off in December:
Lead Goal Conversion
When you create a campaign you can set up goals:
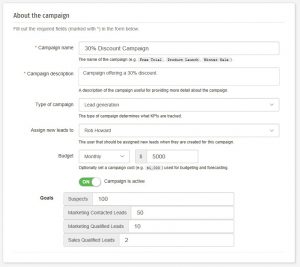
For example, you can specify the goal for the number of leads (Marketing Contacted Leads in the screenshot above). These goals are used in a couple of different ways:
- Goals are shown on the campaign landing page and provide a comparative analysis as to where you are for the current month along with a forecast based on historical trends.
- Goals are summarized in the lead summary report to show how that campaign performed against its goals for the period measured.
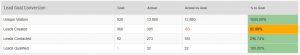
Detail by Campaign
Finally, the last part of the lead summary report is a line-by-line detail for how each campaign contributed to visitors, leads, etc. Currently, this report links back to the campaign, but in the next few weeks, it will link to a drill-down report for the campaign:

Future updates
A couple of things we have planned for this report:
- For customers using Salesforce, we’re going to expand this report to also show additional funnel detail such as whether the lead is qualified, dead or converted into an opportunity.
- In addition to goal setting, we’re going to include the financial details included in campaigns. This enables you to set additional monetary values to campaigns, in addition to activities like paid search, and generate reports on lead acquisition cost.